What Does the Decline in Vehicle Miles Traveled Mean?
Here’s an interesting graphic that suggests a phenomenon that my colleague Jeff Siegel calls “peak car” – a definitive decline in the number of vehicle miles traveled in the U.S. Granted, there are numerous factors that come together to push a change like this, and there is no guarantee that the trend will continue.
But it sure makes one wonder: Is the “bloom off the rose” for the concept of individual vehicle ownership? Has the combined impact of concepts such as mass transit, car-sharing, ride-sharing, micro-rentals, small urban commuter and package-delivery vehicles, redesigned cities, environmentalism – perhaps even the health aspects of biking and walking – begun to touch a chord in the American psyche?
We’ll see.


Gas costs a lot more than it used to. Nuff said.
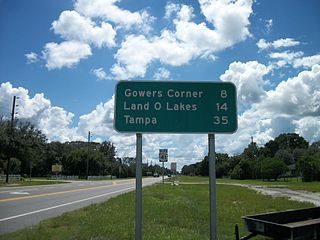
Oh come on you should be able to do better than this, I live about 20 miles east of this spot. The road pictured is US-41 coming South out of Brooksvile, Florida, that road is crowded in the winter but this picture was taken in the summer when 1/3 of the population is living in the north-eastern US and mid-western states. where the retirees go every summer. also this could be a Sunday when traffic in Most Florida streets and highways is much lighter. It is only a two lane road with added turn only lanes. There is an Interstate ten miles to the east and and a state highway with six lanes two miles to the west, why would anyone drive all 35 miles to Tampa on the “Old Highway” they drive on the expressways. The neighborhood is all farmland along this stretch of road. Heck you could have substituted a picture of the road past my home, two lane four miles between stop signs, average 4 cars per hour and perhaps 6 cars all night long. And yet a numbered highway between two towns but all the traffic flows along the parallel Interstate 75 less than two miles to the West. Because our road has a 45 mph speed limit. It certainly is not due to a lack of cars, just looking at the wrong street or road.
I don’t think that this decline has anything to do with altruistic motives. People are driving less because their income is going down on the average due to less people working now than 10 years ago. While our safety net of government packages for the unemployed is generous IMO, it does cut into disposable income. They have to stretch food stamps, health costs, booze and drugs. Personal transportation costs have to be cut. If the economy picks up, I think the auto industry will pick up also along with miles driven.
Craig,
The link to the graphic didn’t work, but I was highly dubious that there has been a considerable lessening of VMT, so I googled it.
It looks like America’s VMT peaked in 2007 at 3.03 trillion miles (TMi), then we see the following:
2008 – 2.98 TMi
2009 – 2.96 TMi
2010 – 2.97 TMi
2011 – 2.93 TMi
2011 YTD through Nov – 2.71 TMi
2012 YTD through Nov – 2.70 TMi
So from the peak of 2007, the country went through a great recession, and from 2007 to 2011 the total vehicle miles driven dropped 10%, and seems to be on track to have dropped another .4% in 2012. So ~10.4% in 5 years… I stand corrected, that is a significant drop averaging ~2%/year, while the driving age population has increased ~1%/year, so we have a ~3%/year/capita reduction. Wow!
My suspicion is that job loss and telecommuting are the greatest contributor of the drop, with all other factors coming in very distant second… but 2011 saw a significant drop even as total jobs increased, so telecommuting may have dramatically increased during that period… or other factors must clearly be in effect. The price of fuel combined with a lower discretionary budget would serve to force people to consolidate trips and reduce the amount of recreational travel/vacations (this factor probably being second most significant). I would suspect that the aging of vehicles has probably served as the third biggest factor, as people tend to baby older cars.
I am highly doubtful that increased car-pooling has had much of an effect (especially as some misguided environmentalists are campaigning for single-occupancy use of HOV lanes for cars with greater carbon footprints)… and I am doubtful that there has been much population movement back into the city during a period when no-one can sell their existing house nor get a loan for a new condo.
😉
Those are my thoughts.
Here’s the unadulterated link:
http://advisorperspectives.com/dshort/updates/DOT-Miles-Driven.php
Population adjusted graph shows 8.72% down from peak. I can’t tell from just this page without doing more research if this is VMT or LVMT (light VMT). If it was LVMT, I suspect Glenn is spot-on with the estimation of job loss. The U6 has been in the 20+ percentile for some time now. Fewer people are commuting. Gas is more expensive.
Thanks for the fixed link Arlene. That is much clearer.
I can tell you that when I looked up the numbers, I specifically looked up total VMT, and the numbers in the first graph (hovering ~3 TMi), match what I found for total VMT.
I would therefore suspect the rest of the graphs were likewise analyzing total VMT.