Map of U.S. Shows New Hot Spots
 Americans: Here’s a map that shows what global warming has done to the temperatures in your locale since record-keeping began in the late 19th Century. Ack! 2GreenEnergy “headquarters” in Santa Barbara, CA is one of the most heavily affected.
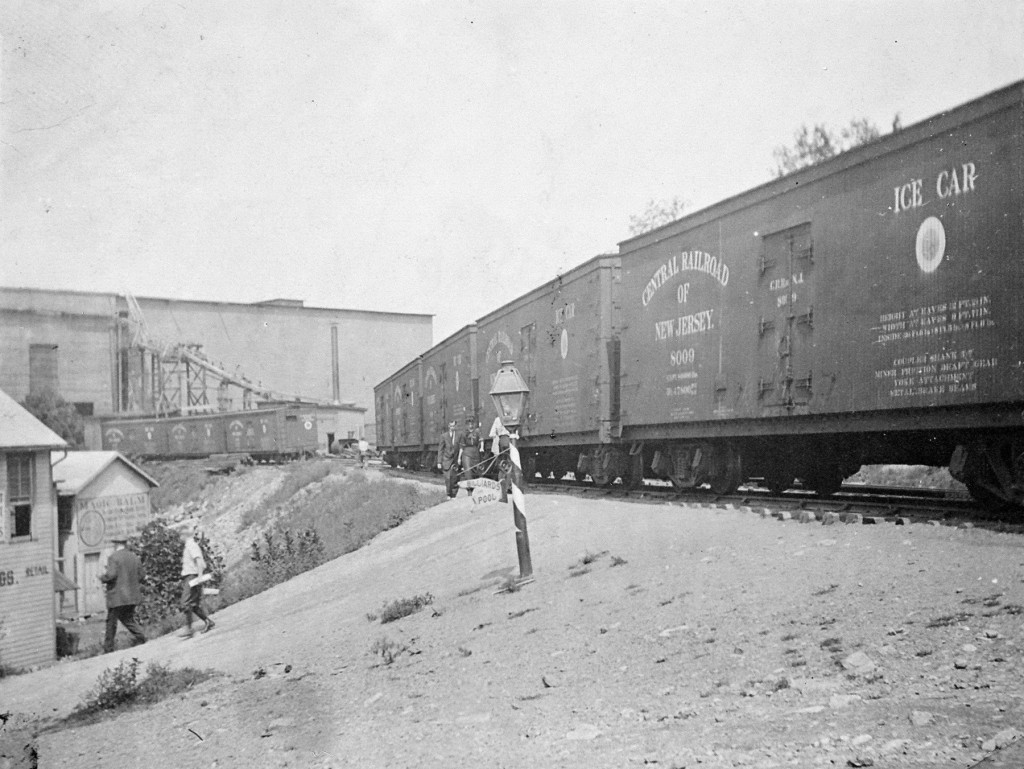
In the early 20th Century, before refrigeration, the winter ice in Northern 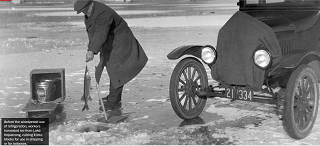 New Jersey’s Lake Hopatcong (see right) was harvested and sent to New York City by box-car (at left). After an average warming of ~3°C (~5.4°F), the lake still freezes, though nothing like the thickness and duration of the winter season of yore.